System requirements:
Windows 10 or later / macOS 10.14 or later / Linux (64-bit, released 2022 or later — e.g. Ubuntu 22.04+, Debian 12+, Fedora 38+).
Older Linux distributions may not be compatible; if the app fails to launch on an older system, please contact us and we can provide a build for your specific distribution.
No separate Python installation needed — everything required is bundled. Download size is approximately 150–500 MB
depending on platform, since a full scientific computing stack is included.
| Operation Systems | Download |
| Windows 10 or later | file |
| macOS 10.14 or later | file |
| Linux (64-bit, released 2022 or later) | file |
Note: this software is not yet code-signed. On first launch, your operating
system may show a security warning — this is expected for unsigned software, not a sign of
a problem with the file.
On macOS: right-click (or Control-click) the app and
choose "Open", then confirm "Open" in the dialog that appears.
On Windows: if
SmartScreen appears, click "More info", then "Run anyway".
For input file format, please download the example input files: relaxometry data for E. coli ribonuclease HI
No installer needed — this is a portable, ready-to-run application.
- Download the zip file for your operating system above.
- Unzip it. Keep the executable together with its accompanying folder (e.g. "_internal") —
they must stay in the same directory for the app to run.
- Double-click the application to launch it. A browser tab will open automatically with the
interface — no separate browser setup is needed.
- A console/terminal window will also open in the background. Leave it running — closing it
will shut down the app. This is expected behavior for this release.
This is an early-access (beta) release. We're actively refining it based on real-world use —
feedback, bug reports, and feature requests are very welcome via our
Contact page.
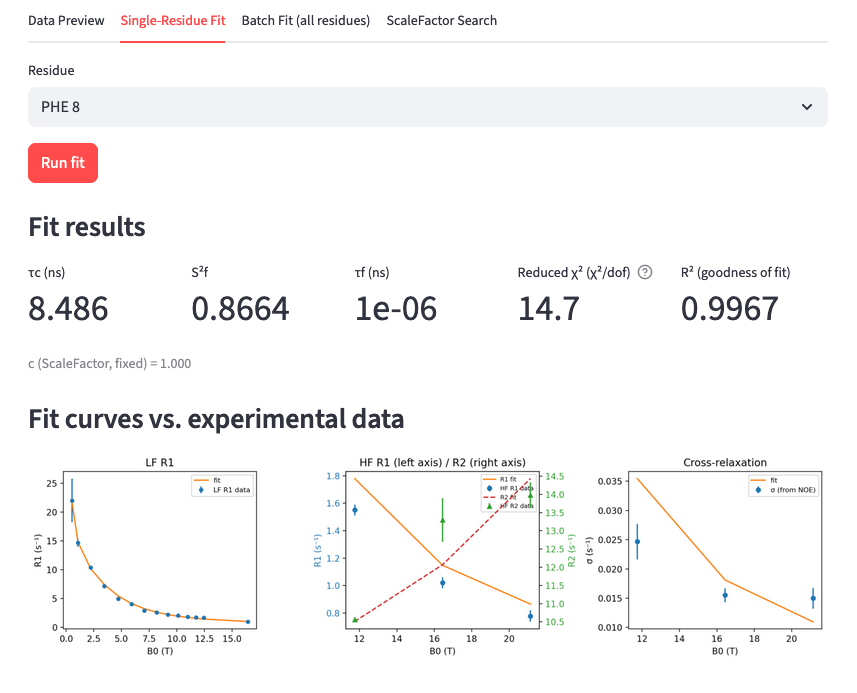
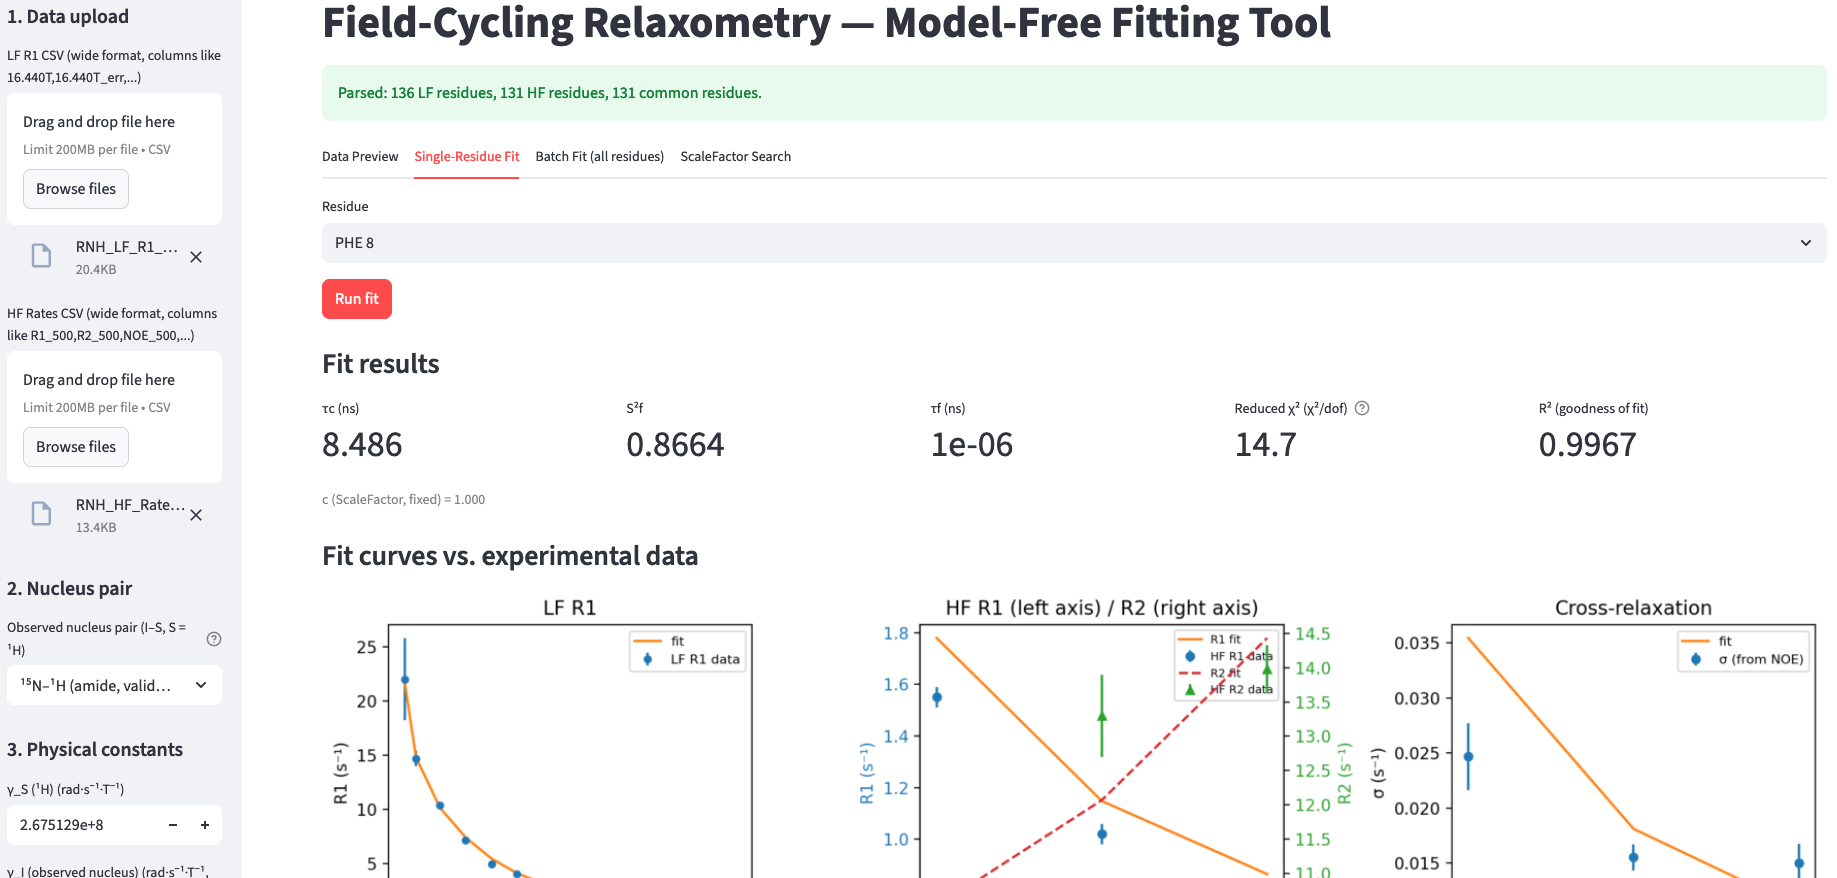
Single-residue fit: parameters and fit curves, generated directly in the app.
- Upload the LF (field-cycling) R1 CSV and the HF (static high-field) Rates CSV in the sidebar. Use the precise-field-value ('_cc') style LF file — column headers with decimal Tesla values, e.g. '16.440T', not rounded whole-Tesla labels — to avoid a systematic field-offset in the fit.
- On Multi-Nucleus-Pair Support:
- 15N–1H (amide, validated) — the default
- 13C–1H (aliphatic/methyl, UNVALIDATED) — fills in literature-typical γ, bond length, and CSA defaults, but the steady-state remote-1H-bath formula itself has NOT been checked against real 13C data yet. The app shows a warning when this preset is active. Treat results as exploratory until validated against a real 13C dataset
- Custom — set every constant by hand.
-
Check/adjust physical constants (γ_N, γ_H, r_NH, r_HH, CSA_N, CSA_H ...).
-
Data Preview tab: sanity-check the parsed LF/HF data before fitting anything.
- ScaleFactor Search tab: run a grid search across a subset of residues to find the dataset-wide consensus ScaleFactor (c), matching the reference notebook's methodology (trimmed mean/median across residues, NOT fit per residue).
-
Enter that consensus c into the sidebar "ScaleFactor (c)" field — it's applied as a single fixed value to every residue, exactly as in the reference workflow.
-
Single-Residue Fit tab: test one residue, see fitted parameters (τc, S2f, τf, S2s, τs, Rex), χ2, and R2 (goodness of fit), plus comparison plots.
- Batch Fit tab: fit every common residue, download results as CSV.
-
LF field range slider (sidebar, appears after data is loaded): Options to exclude outliers if neccessary.
If you publish or present results from this tool, please cite:
- Bhattacharya, S. et al. (2025). Steady-state relaxometry paper. Journal of Magnetic Resonance. doi: 10.1016/j.jmr.2025.107989
- Palmer, A.; Bhattacharya, S. (2025). Relaxometry for human ubiquitin and E. coli ribonuclease HI. Mendeley Data, V1. doi: 10.17632/ssrg4pwtt2.1
Also shown in-app under the sidebar "Citation / references" expander.
This tool combines two components under different licenses:
-
Core algorithm: the steady-state relaxometry method, developed by Arthur G. Palmer and Shibani Bhattacharya (Columbia University / NYSBC), available under CC BY 4.0 via Mendeley Data (doi: 10.17632/ssrg4pwtt2.1) — free to use, including commercially, with attribution.
-
Packaged application (this tool): the GUI, executables, and documentation, developed by Field Cycling Technology Ltd., available under CC BY-NC 4.0 — free for non-commercial use, with attribution. For commercial use, please contact us.
Frequently Asked Questions
-
What is the Relaxometry App?
It is free, open-source software that fits combined low-field (field-cycling) and high-field NMR relaxation data to the Lipari-Szabo Model-Free spectral density function, extracting per-residue rotational correlation times and order parameters for protein backbone dynamics.
-
Is the Relaxometry App free to use?
Yes. The core steady-state relaxometry algorithm is available under CC BY 4.0 via Mendeley Data. The packaged application (GUI and executables) is available under CC BY-NC 4.0, free for non-commercial use with attribution. For commercial use, please contact us.
-
What operating systems does it support?
Windows 10 or later, macOS 10.14 or later, and 64-bit Linux distributions released in 2022 or later (for example Ubuntu 22.04+, Debian 12+, or Fedora 38+).
-
Do I need to install Python separately to run it?
No. The application bundles the full scientific computing stack it needs, so no separate Python installation is required. The download is approximately 150–500 MB depending on platform.
-
Which nuclei pairs does the app support?
The default and validated preset is 15N–1H (amide). A 13C–1H (aliphatic/methyl) preset is also included but is not yet validated against real 13C data and should be treated as exploratory. You can also set every physical constant by hand for a fully custom nucleus pair.
-
Why does my operating system show a security warning when I open the app?
The software is not yet code-signed, so this warning is expected and not a sign of a problem with the file. On macOS, right-click the app and choose "Open", then confirm in the dialog. On Windows, if SmartScreen appears, click "More info", then "Run anyway".
-
How do I cite this tool in a publication?
Please cite Bhattacharya, S. et al. (2025), Journal of Magnetic Resonance, doi: 10.1016/j.jmr.2025.107989, and Palmer, A.; Bhattacharya, S. (2025), Mendeley Data, doi: 10.17632/ssrg4pwtt2.1. The same references are also shown inside the app under the sidebar's "Citation / references" expander.
-
Is this a stable release?
This is an early-access (beta) release. It is being actively refined based on real-world use, and feedback, bug reports, and feature requests are welcome via our Contact page.